Assigned colors can faithfully represent real measurements. Read the caption to understand which wavelengths or features each color represents.
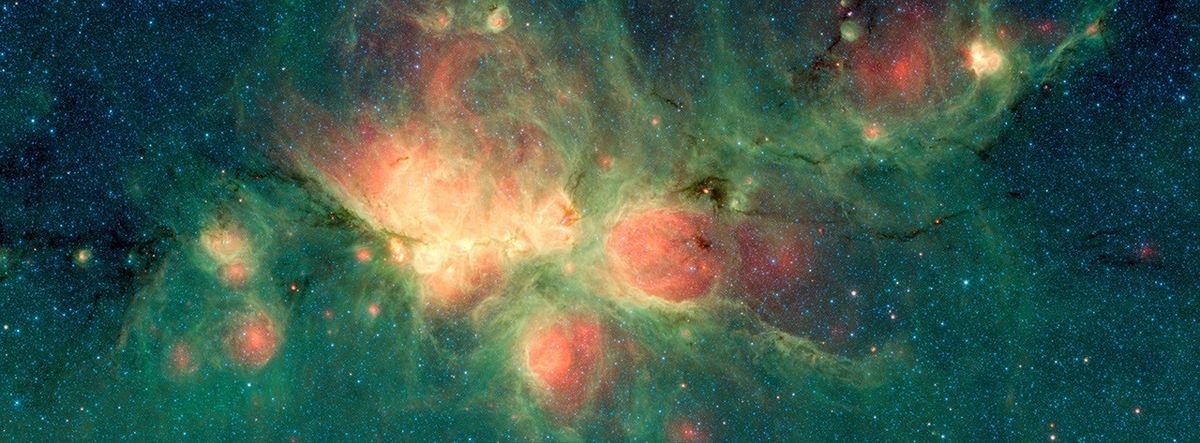
A nebula glows green and red against a crowded field of stars. It is a real observation, but it may not resemble what an astronaut would see through a window.
That does not make the image fake. It means the telescope and your eyes are detecting different kinds of light, and the image needs a translation.
Telescopes can see beyond visible light
Human vision covers a limited range of wavelengths. Astronomical instruments can measure light outside that range, including infrared, ultraviolet and X-rays.
Those measurements do not arrive as a finished color photograph ready for a screen. They are data. To make them visible, image specialists assign display colors to selected measurements.
The image on this page comes from the Spitzer Space Telescope's infrared observations of the Cat's Paw Nebula. Its caption and source identify the instrument and the color representation. It is not a newly taken visible-light photograph.
Filters separate the information
A telescope can observe through different filters, each selecting a range of wavelengths. The resulting images can be combined into a color composite.
NASA explains that Webb's image specialists commonly map shorter infrared wavelengths toward bluer visible colors and longer wavelengths toward redder ones. The exact assignments are documented for each image.
A color key is therefore part of the explanation. Without it, guessing that red always means hotter, older or farther away can lead you astray.
“False color” does not mean false data
The term can sound suspicious because it uses the word false. In this context, it generally means the displayed colors are assigned rather than a direct reproduction of ordinary human color vision.
Think of a weather map. Blue and red can represent temperatures, even though the air itself is not painted those colors. The map is useful when its scale and legend are clear.
Astronomical color assignments can reveal differences that would otherwise be invisible. The important question is whether the processing and interpretation accurately represent the measurements.
Brightness is adjusted too
Astronomical scenes often contain very bright and very faint structures in the same field. Display adjustments can make faint detail visible without allowing the brightest regions to dominate everything.
Such processing requires choices. A science image is therefore best understood alongside its explanation, not as a transparent window with no interpretation involved.
This is also why two images of the same object may look dramatically different. They may use different instruments, wavelengths, exposure times or processing choices.
Read a space image in five steps
- Identify the telescope and instrument.
- Check whether it is an observation, simulation or artist's concept.
- Read what the colors represent.
- Look for the observation date, field of view and scale.
- Separate what is directly measured from what researchers infer.
Do not assume every striking picture accompanying a discovery shows the discovered object directly. An artist's concept can be useful, but it answers a different visual question.
The colors make the universe easier to study and share. Once you know the translation being used, the picture becomes more interesting: you are looking at a carefully constructed view of information human eyes could never gather on their own.
Sources & further reading
Original explainers and practical examples, with technical background from the sources below. Source links reviewed 2026-10-03.
More context, fewer assumptions. About our editorial approach.